CSCI 564 Homework 1 (Due Tuesday, October 15)
Maximum Selector Model
The NSL code for this model is available in the directory
NSL/nsl3_0/MaxSelectorModel/1_1_1/src under csci564 account (You
can access to this directory with cd ~csci564/NSL/nsl3_0/MaxSelectorModel/1_1_1/src
when you are logged on a scf machine like aludra).
Before doing the homework, simply try to run the model, and print
out the resultant graphs to make sure you understand the basic mechanics
of logging in, retrieving files, running files, and printing output. DO
THIS AS SOON AS POSSIBLE. If you have any problems, consult the TA. If
you leave this to the last moment, you will not be able to complete the homework
in time. Mastery of your simulation environment is one of your top priority
for course.
The Homework
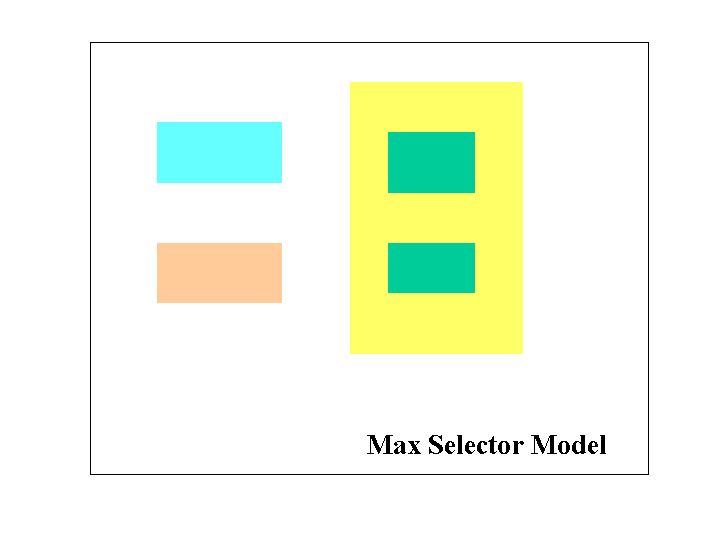
- This exercise is for familarizing yourself with the NSL code. Go through
the NSL code in Max Selector files (*.mod in Max Selector Model directory)
and fill in the following details on the Figure. [total 2 pts]
1. The names of the modules ( name each colored box) [.5 pt]
2. Draw the arrows between modules and label the inport and outport variables
related with the arrows. [1 pt]
3. Put + or - on the each arrow to indicate whether the connection is inhibitory
or excitatory, [.5 pt]

- The S you are given creates two "flies" (peaks of activity) in your
input layer, one with activity 0.5, the other with activity 1.0. [total
4 pts]
- Choose the four parameters (w1, w2, h1, h2) so that only
the single greatest peak appears in the network's output. [1 pt]
- If w2=1, h1=0.1, and h2=0.5 then what is
the range of values for w1 so that, after settling, exactly one fly
is recognized? [2 pt]
Hint: read the results in Section 4.4 of TMB2.
- Justify your theoretical result with simulation by printing out graphs
that show the performance of the model for w1 values which define
the range. Submit these graphs. [1 pt]
- Make the "flies" move after the network settles. Make the closest
"fly" (largest input activity) move away (activity decreases) while the
nearest "fly" approaches (activity increases) (e.g. set the run time to
30 sec and start changing the input after 15 sec). [total 4 pts]
- Demonstrate the property of "hysteresis", by finding parameters
such that the network does not switch its attention to the new maximum,
but stays stuck on the old one. [4 pts]
Print out and hand in the temporal graphs for
- the input layer,
- the "relative foodness" layer's membrane potential u, and
- the "relative foodness" layer's firing rate U.
Again, report the network parameters used.
You are encouraged to experiment with the model on your own, to see
how varying the parameters affects the model's performance. Some things to
vary are:
- the parameters h1 and h2,
- the time step,
- the leaky integrator time constants, and
the non-linearities (e.g. replace the ramp function with a sigmoidal function.)
NSL SETUP FOR HOMEWORKS
To be done only once:
login to one of scf machines, say aludra (like telnet aludra)
login:trojan
passwd:mytrojanpassword
create a directory called nsl. You are going to keep your models in this
directory.
mkdir nsl
copy the file ~csci564/NSL/resume under nsl.
cp ~csci564/NSL/resume nsl
To be done only starting a new model for the
first time:
Under nsl directory make a directory for the model and copy the model
source (if provided)in this model directory
login to your scf account
cd nsl
mkdir maxselector
cp ~csci564/NSL/nsl3_0/MaxSelectorModel/1_1_1/src/* maxselector (assuming
we are provided with MaxSelector)
To be done each work session, before starting to
work with NSL
login to your scf account
cd nsl
source resume
cd maxselector , assuming you are going to work on
this model
to run the model:
nsl MaxSelectorModel
to compile the model:
nslc MaxSelectorModel
