
Shifting attention away from a visual stimulus reduces, but does not abolish, visual discrimination performance. This residual vision with `poor' attention can be compared to normal vision with `full' attention to reveal how attention alters visual perception. We report large differences between residual and normal visual thresholds for discriminating the orientation or spatial frequency of simple patterns, and smaller differences for discriminating contrast. A computational model, in which attention activates a winner-take-all competition amongst overlapping visual filters, accounts quantitatively for all observations. Our model predicts that the effects of attention on visual cortical neurons include increased contrast gain as well as sharper tuning to orientation and spatial frequency.
For additional details, please chek our related papers from our publication server.
Observers discriminated contrast, orientation, or spatial frequency of a luminance-modulated pattern appearing at varying locations of 4deg eccentricity (`peripheral target') (Fig. 1A). To draw attention away from this pattern, we asked observers to discriminate whether five shapes near fixation (`central targets') were the ``same'' or ``different''. When observers carried out both tasks, they concentrated attention on the central task, which they were instructed to consider the primary task, and thus left the peripheral target `poorly attended' (double-task thresholds). In contrast, when observers viewed the same display but performed only the peripheral task, they `fully attended' to the peripheral target (single-task thresholds). The comparison of single- and double-task thresholds reveals if and how attention alters visual perception.
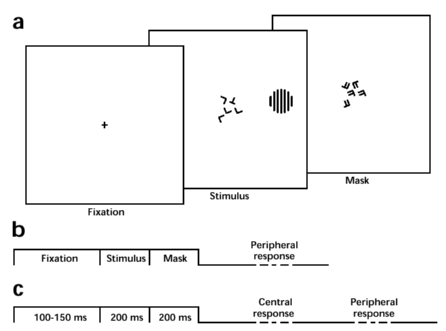 | Figure 1. Measurement of visual thresholds with either full or poor attention. (A) Sequence of fixation, stimulus, and mask displays (schematic). Observers fixate the center of all displays. The stimulus comprises a central and a peripheral component, which appear at varying locations of constant eccentricity. The central component consists of 5 Ts and/or Ls (``central targets'') and observers report ``same'' (i.e., 5 Ts or 5 Ls) or ``different'' (i.e., 4 Ts + 1 L or 4 Ls + 1 T). The peripheral component consists of the luminance-modulated patterns shown in Fig. 2A-E (``peripheral target''). For example, the peripheral component might be a grating pattern of vertical or tilted orientation, in which case observers would report ``vertical'' or ``tilted.'' The mask display limits visual persistence of central targets. (B) Single-task (peripheral target `fully attended'): observers fixate the center but respond only to the peripheral task (see Fig. 2). (C) Double-task (peripheral target `poorly attended'): observers fixate the center and respond first to the central task and second to the peripheral task. |
We compared five types of thresholds under single- and double-task conditions (Fig. 2A-E). When peripheral targets are fully attended, contrast detection thresholds (zero mask contrast) are about 20% lower and contrast discrimination thresholds (mask contrast greater than zero) about 40-50% lower than when peripheral targets are poorly attended (Fig. 2A). In addition, the decrease of the discrimination threshold as mask contrast increases from zero (dipper) is evident only when targets are fully attended.
The effects of attention on spatial frequency and orientation discrimination are even larger (Fig. 2B,C). Spatial frequency thresholds are about 60% lower and orientation thresholds about 70% lower when peripheral targets are fully attended, compared to when they are poorly attended. Note that both types of thresholds remain essentially constant for contrast values above 20%.
Interactions between superimposed stimuli of different orientation or spatial frequency (target and mask; Fig. 2D,E) are also altered by attention. When target and mask have similar orientation or spatial frequency, attention lowers the maximal threshold by about 50% (consistent with Fig. 2A, mask contrast 0.5). As target and mask become progressively more different, fully and poorly attended thresholds decrease towards the same baseline level. The baseline is comparable to thresholds without mask (Fig. 2A, mask contrast 0.0), indicating minimal interactions between targets and masks of very different orientation or spatial frequency.
| Figure 2. Single- and double-task thresholds compared. Five types of thresholds were measured. In each case, observers discriminate between two alternative forms of the peripheral (4deg eccentricity) target. Red and blue symbols represent fully attended (single-task) and poorly attended (double-task) thresholds, respectively (mean and standard error of 3 observers). Continuous curves represent model predictions. (A) Contrast detection and discrimination: Observers report the presence (arrows) or absence of a vertical target stripe from a circular masking pattern (contrast range 0.0-0.5). (BC) Spatial frequency and orientation discrimination: Observers report whether a circular target grating (contrast 0.02---0.8) exhibits higher or lower spatial frequency (in B), or whether its orientation is vertical or tilted clockwise (in C). (DE) Orientation and spatial frequency masking: Observers report the presence (arrows) or absence of a vertical target stripe from circular masking patterns (contrast 0.5) of different orientation (difference range 0-90deg, in D) or different spatial frequency (difference range -1 to +1oct, in E). (F) Model parameters: Solid curves represent plausible fits computed separately for single- and double-task data (all 10 parameters are permitted to differ). (*) indicates further data points off scale. | 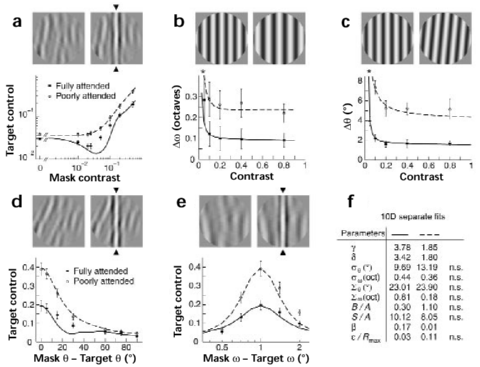 |
The visual thresholds measured here are thought to reflect the activity of a population of `noisy filters' selective for stimuli of different orientations and spatial frequencies. We use a computational model to relate the observed psychophysical thresholds to activity in single neurons. The model is described in more details here.
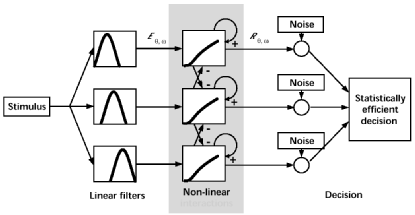 | Figure 3. Three-stage model of visual filters and their interactions (schematic). Each stimulus location is analyzed by linear filters sensitive to different orientations and spatial frequencies. Filter responses are subjected to excitatory and inhibitory interactions in the form of amplification and divisive normalization. The decision stage assumes that non-linear responses exhibit a variance similar to that of cortical neurons and chooses between stimulus alternatives on the basis of maximal likelihood. See here for details. Our results suggest that attention strengthens non-linear interactions between filters, but does not affect other parts of the model. |
Can the observed effects of attention be understood simply as a change in the properties of individual visual filters? To answer this question, we use our computational model and start by separately predicting the fully- and poorly-attended datasets. Comparing the resulting parameters across both conditions suggested that changing only the strength of neuronal interactions (second stage of our model) acounts fairly well for the observed pattern of attentional modulation.
| Figure 4. Predicted thresholds when attention changes some model parameters but not others. Experimental data is identical to Fig. 2. The solid curves represent a simultaneous fit to both single- and double-task data, in which only the exponents gamma and delta take different values depending on attention (12 free parameters). Observed and predicted thresholds agree reasonably well, and parameters values are physiologically plausible (two leftmost columns in F). The dashed curves represent the optimal joint fit when all parameters except the exponents gamma, delta take different values depending on attention (18 free parameters). Neither the dipper (A) nor the maximal extent of contrast masking (D,E) are predicted, and parameter values are unrealistic (two rightmost columns in F). | 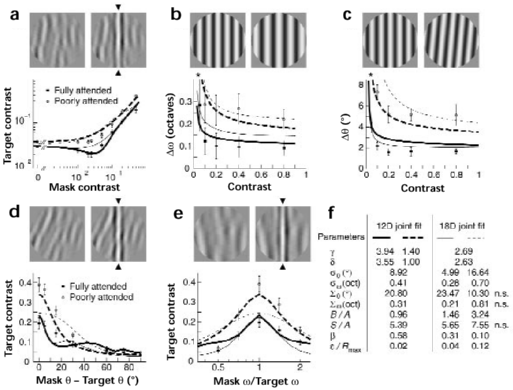 |
Our model predicts two effects of attention on single neurons, which result from the strengthening of neuronal interactions with attention: An increase of neuronal gain with attention, and a sharpening of neuronal tuning with attention.
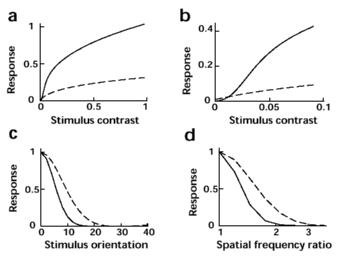 | Figure 5. Effect of attention on early visual processing. Predictions based on 12-dimensional joint fit in Fig. 4F. Attention increases the contrast gain (3.3-fold, A), causes the contrast response to assume sigmoidal shape at low contrast (B), sharpens orientation tuning (by 40%, C) and spatial-frequency tuning (by 30%, D). To the extent that the visual filters of our model reflect individual neurons in visual cortex, this predicts that attention both increases the gain and sharpens the tuning of such neurons. |
Taken together, our results may be summarized by considering that attention activates a winner-take-all competition among early visual neurons tuned to arious stimulus dimensions at one visual location.
Our study has provided a very general (five psychophysical tasks and 32 thresholds are predicted simultaneously for two attended conditions by a single model) computational hypothesis for the modulatory effect of attention on early sensory processing.
| Figure 6. Attentional change in the response distribution. Predictions based on 12-dimensional joint fit in Fig. 4F. Responses R(theta,omega) of filters tuned to orientations between -20deg to +20deg to a grating stimulus of orientation 0deg and contrast between 0 to 0.05 (threshold regime). Responses to fully and poorly attended stimuli are represented by the red and blue surfaces, respectively (shown interleaved for clarity). By strengthening a winner-take-all competition amongst visual filters, attention restricts responses to the filters tuned best to the stimulus at hand. | 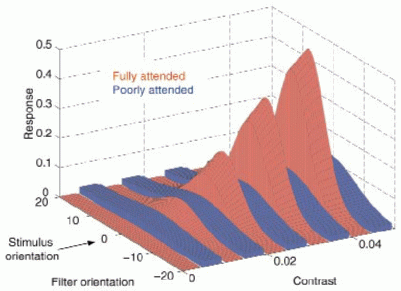 |
We are starting a combined fMRI, psychophysics and modeling experimental program to better tease apart the effect of top-down attentional modulation on early visual processing.
As part of this program, we have recently compared our winner-take-all hypothesis to a number of other candidate hypotheses, as presented in our NIPS paper, and shown on this poster.
Copyright © 2000 by the University of Southern California, iLab and Prof. Laurent Itti