
Public Member Functions | |
| PlotBufferList () | |
| constrcutor | |
| ~PlotBufferList () | |
| destructor | |
| void | push (const std::vector< const SimUnit * > &nsm, const uint length=250, const uint depth=4, const bool usedisplayout=false) |
| add data from a vector of neural simulation modules | |
| void | clear () |
| clear all plots in buffer | |
| Layout< PixRGB< byte > > | draw (bool clear=false, const uint w=640, const uint h=480, const Dims &d=Dims(0, 1), const Range< double > &range=Range< double >(0.0, 0.0)) |
| void | draw (Image< PixRGB< byte > > &img, bool clear=false, const uint w=640, const uint h=480, const Dims &d=Dims(0, 1), const Range< double > &range=Range< double >(0.0, 0.0)) |
| into an image - see above | |
| void | setSamplingRate (const SimTime &samplerate) |
| set the sampling rate of the input so the x-axis can be properly labeled | |
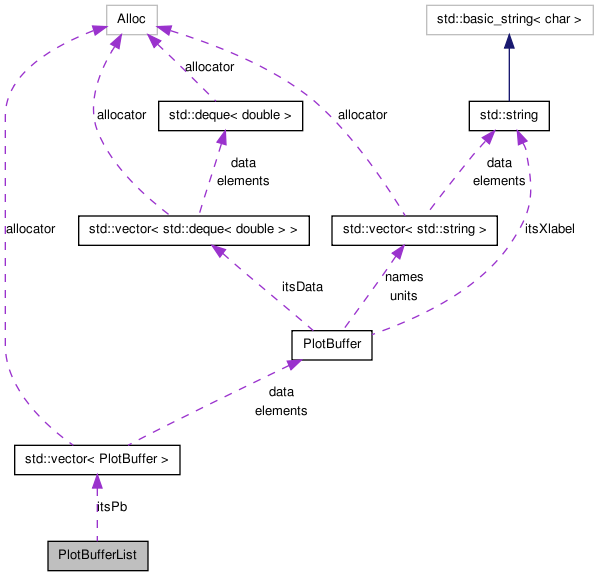
Definition at line 108 of file PlotBuffer.H.
| PlotBufferList::PlotBufferList | ( | ) | [inline] |
constrcutor
Definition at line 112 of file PlotBuffer.H.
| PlotBufferList::~PlotBufferList | ( | ) | [inline] |
destructor
Definition at line 116 of file PlotBuffer.H.
| void PlotBufferList::clear | ( | ) |
clear all plots in buffer
Definition at line 276 of file PlotBuffer.C.
Referenced by StructurePlot::setProbe().
| Layout< PixRGB< byte > > PlotBufferList::draw | ( | bool | clear = false, |
|
| const uint | w = 640, |
|||
| const uint | h = 480, |
|||
| const Dims & | d = Dims(0,1), |
|||
| const Range< double > & | range = Range<double>(0.0, 0.0) | |||
| ) |
get a layout of the plot, Dims(1,0) will contatinate images along the horizontal axis. Dims(0,1) will contatinate along the vertical axis. For other Dims configurations the function will attempt to fill a grid, working across columns until the data is exausted for the grid is filled.
Definition at line 282 of file PlotBuffer.C.
References Dims::h(), height, and Dims::w().
Referenced by draw(), and StructurePlot::draw().
| void PlotBufferList::push | ( | const std::vector< const SimUnit * > & | nsm, | |
| const uint | length = 250, |
|||
| const uint | depth = 4, |
|||
| const bool | usedisplayout = false | |||
| ) |
add data from a vector of neural simulation modules
Definition at line 257 of file PlotBuffer.C.
Referenced by StructurePlot::draw().
| void PlotBufferList::setSamplingRate | ( | const SimTime & | samplerate | ) |
set the sampling rate of the input so the x-axis can be properly labeled
Definition at line 329 of file PlotBuffer.C.
Referenced by StructurePlot::setSamplingRate().
 1.6.3
1.6.3