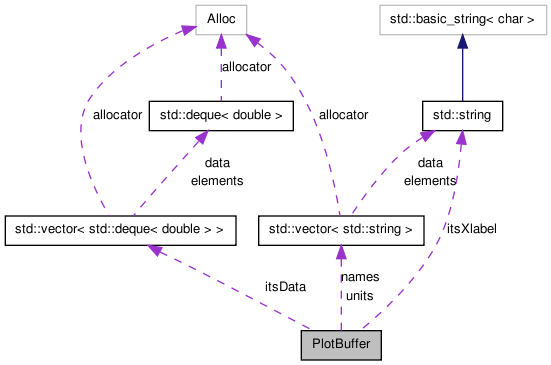


Public Member Functions | |
| PlotBuffer () | |
| ~PlotBuffer () | |
| !destructor | |
| void | push (const SimUnit &nsm, const uint length=250, const uint depth=4, const bool usedisplayout=false) |
| push data onto the plot buffer | |
| void | reset () |
| reset the state to that just after construction | |
| Layout< PixRGB< byte > > | draw (const bool clear=false, const uint w=640, const uint h=480, const Range< double > &range=Range< double >(0.0, 0.0)) |
| plot and possibly clear the buffer | |
| void | draw (Image< PixRGB< byte > > &img, const bool clear=false, const uint w=640, const uint h=480, const Range< double > &range=Range< double >(0.0, 0.0)) |
| plot and possibly clear the buffer | |
| void | setSamplingRate (const SimTime &time) |
| set the sampling rate of the input so the x-label can be set correctly | |
| const uint | getTotal () |
| get the total number of units plotted by this buffer | |
Static Public Member Functions | |
| static std::string | SimTimeToSI (const SimTime &time) |
Definition at line 50 of file PlotBuffer.H.
| PlotBuffer::PlotBuffer | ( | ) |
This will only construct the object. The object will be setup on the first call to push(). w and h set the maximum size of the display. Length is the number of samples to display in the window. Use 0 for length to display all samples.
Definition at line 44 of file PlotBuffer.C.
| PlotBuffer::~PlotBuffer | ( | ) | [inline] |
!destructor
Definition at line 60 of file PlotBuffer.H.
| Layout< PixRGB< byte > > PlotBuffer::draw | ( | const bool | clear = false, |
|
| const uint | w = 640, |
|||
| const uint | h = 480, |
|||
| const Range< double > & | range = Range<double>(0.0,0.0) | |||
| ) |
plot and possibly clear the buffer
Definition at line 119 of file PlotBuffer.C.
References height, linePlot(), Range< T >::max(), Range< T >::min(), and ZEROS.
Referenced by draw().
| const uint PlotBuffer::getTotal | ( | ) |
get the total number of units plotted by this buffer
Definition at line 173 of file PlotBuffer.C.
| void PlotBuffer::reset | ( | ) |
reset the state to that just after construction
Definition at line 103 of file PlotBuffer.C.
Referenced by push().
| void PlotBuffer::setSamplingRate | ( | const SimTime & | time | ) |
set the sampling rate of the input so the x-label can be set correctly
Definition at line 167 of file PlotBuffer.C.
References SimTimeToSI().
| std::string PlotBuffer::SimTimeToSI | ( | const SimTime & | time | ) | [static] |
convert a SimeTime object to its SI representation as a string. For example a SimTime object with a value of .001s will return 'milliseconds', an object with a value of .005ms will return "5 microseconds".
Definition at line 179 of file PlotBuffer.C.
References magnitude(), and SimTime::toString().
Referenced by setSamplingRate().
 1.6.3
1.6.3