
We present a robot localization system using
biologically-inspired vision. Our system models two extensively
studied human visual capabilities: (1) extracting the “gist” of
a scene to produce a coarse localization hypothesis, and (2)
refining it by locating salient landmark regions in the scene.
Gist is computed here as a holistic statistical signature of the
image, yielding abstract scene classification and layout. Saliency
is computed as a measure of interest at every image location,
efficiently directing the time-consuming landmark identification
process towards the most likely candidate locations in the
image. The gist and salient landmark features are then further
processed using a Monte-Carlo localization algorithm to allow
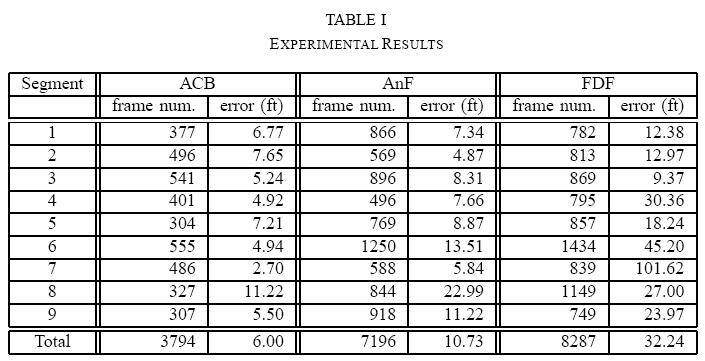
the robot to generate its position. We test the system in three
different outdoor environments - building complex (126x180ft.
area, 3794 testing images), vegetation-filled park (270x360ft.
area, 7196 testing images), and open-field park (450x585ft. area,
8287 testing images) - each with its own challenges. The system
is able to localize, on average, within 6.0, 10.73, and 32.24 ft.,
respectively, even with multiple kidnapped-robot instances.
Index Terms: Gist of a scene, saliency, scene recognition,
computational neuroscience, image classification, image statistics,
robot vision, saliency, robot localization.


 C. Siagian, L. Itti,
Biologically Inspired Mobile Robot Vision Localization,
C. Siagian, L. Itti,
Biologically Inspired Mobile Robot Vision Localization,
IEEE Transactions on Robotics,
Vol. 25, No. 4, pp. 861-873, July 2009.
C. Siagian, L. Itti,
Biologically-Inspired Robotics Vision
Monte-Carlo Localization in the Outdoor Environment,
In: Proc. IEEE/RSJ International
Conference on Intelligent Robots and Systems (IROS),
Oct 2007.
C. Siagian, L. Itti,
Storing and Recalling Information for Vision Localization,
In: IEEE International Conference on
Robotics and Automation (ICRA), Pasadena, California,
May 2008.
C. Siagian, C. K. Chang, R. Voorhies, L. Itti,
Beobot 2.0: Cluster Architecture for Mobile Robotics,
Journal of Field Robotics,
Vol. 28, No. 2, pp. 278-302, March/April 2011.
Existing vision-based localization systems can be categorized according to the type of visual features used: local features and global features. Local features are computed over a limited area of the image, as opposed to global features which may pool information over the entire image into, e.g., histograms. A popular starting point for local features are SIFT keypoints [Lowe2004]. There has been a number of systems that utilize SIFT features [6], [16], [17] in recent years for object recognition because they can work in the presence of occlusion and some viewpoint changes. Other examples of local features are Kernel PCA features [Tamimi] and Harris corners [Frintrop2006]. Some systems [20], [21] extend their scope of locality by matching image regions to recognize a location. At this level of representation, the major hurdle lies in achieving reliable segmentation and in robustly characterizing individual regions. Global feature methods usually utilize color [8], [9], textures [7], or a combination of both [22], [23]. Holistic approaches, which do not have a segmentation stage, may sacrifice spatial information (the location of the features). Yet, some systems [7], [22] try to recover crude spatial information by using a predefined grid and computing global statistics within each grid tile. These methods are limited, for the most part, to recognizing places (as opposed to exact geographical locations) because with global features, it is harder to deduce a change in position even when the robot moves considerably.
Today, with many available studies in human vision, there is a unique opportunity to develop systems that take inspiration from neuroscience and bring a new perspective in solving vision-based robot localization. Our model presented below seeks to employ these two complementary concepts of biological vision, saliency (which, in implementation is aided by SIFT, a local feature) and gist (global and holistic in nature), implemented faithfully and efficiently, to produce a critical capability such as localization. Figure 1 shows a diagram of the full system with each sub-system projected onto its respective anatomical location.
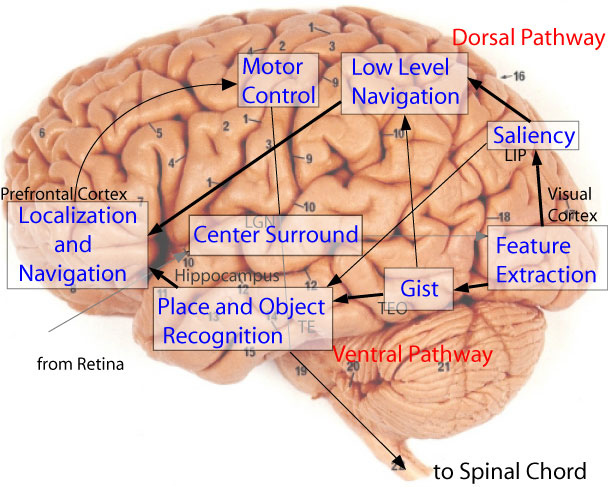
Figure 1. Model of Human Vision with Gist and Saliency.
After early preprocessing that takes place at both the retina and LGN (following figure 1), the visual stimuli arrive at Visual Cortex (cortical visual areas V1, V2, V4, and MT) for low-level feature extractions which are then channeled to the saliency and gist module. Along the Dorsal Pathway or “where” visual processing stream [Ungerlieder1982] (posterior parietal cortex), the saliency module builds a saliency map through the use of spatial competition of low-level feature responses throughout the visual field. This competition silences locations which, at first, may produce strong local feature responses but resemble their neighboring locations. Conversely, the competition strengthens points which are distinct from their surroundings. On the contrary, in the Ventral Pathway or the “what” visual processing stream (inferior temporal cortex), the low-level feature-detector responses are combined to yield a gist vector as a concise global synopsis of the scene as a whole. Both pathways end up at the pre-frontal cortex where concious decisions and motor commands are formed.
In this paper, we concentrate mostly on the ventral pathway, which is responsible for localization.
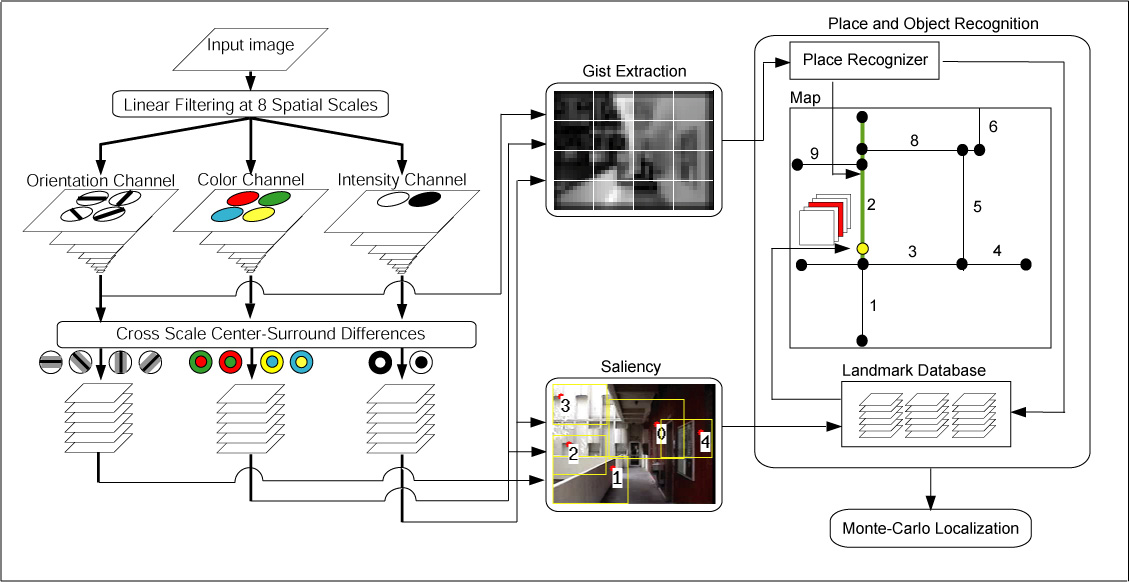
Figure 2 displays the overall flow of the localization system which can be divided to three stages: feature extraction, object and place recognition, and localization. The feature extraction stage takes an image from a camera (or retina in figure 1) and outputs the gist [22] and salient feature computations [26], [45], which are already implemented previously.
Figure 2. Model of Human Vision with Gist and Saliency.
Our main contribution is utilizing both of the sub-systems concurrently in the two subsequent stages. The place and object recognition stage then tries to match these features with memorized information about the environment. These matches are then used as an input to the localization stage to make a decision of where the robot might be. As part of the object and place recognition stage, a map of the environment is associated with the visual information. The map, which is currently provided to the system, is an augmented-topological map. It is a graph-based map with each node having a cartesian coordinate and each edge having its cost set to the distance between the edge’s corresponding end-nodes. This way the system benefits from the compact representation of a graph while preserving the important metric information of the environment. In the map, a robot state (position and viewing direction) is represented by a point which can lie on a node or an edge.
For further analysis, we introduce the concept of a segment. A segment is an ordered list of edges with each edge connected to the next one in the list to form a continuous path. This grouping is motivated by the fact that views/layout in one path-segment are coarsely similar. The selected three edge segment (highlighted in green) in the map of figure 2 is an example. From this point forward, “place” (as in figure 1) and “segment” will be used interchangably to refer to the same notion of a region in a map. Because the map includes a rectangular boundary and an origin, a location can be noted as both cartesian coordinates (x, y) or a pair of segment number and a fraction of length traveled (between 0.0 to 1.0) along the segment (snum, ltrav).
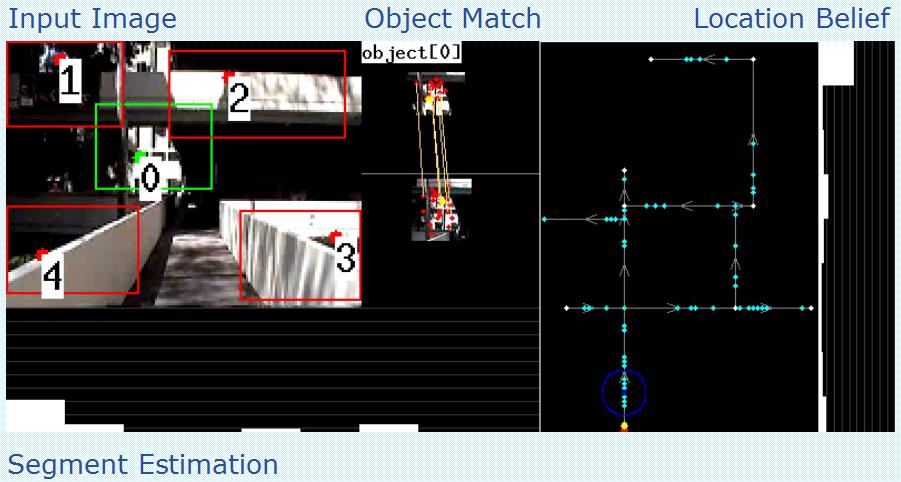
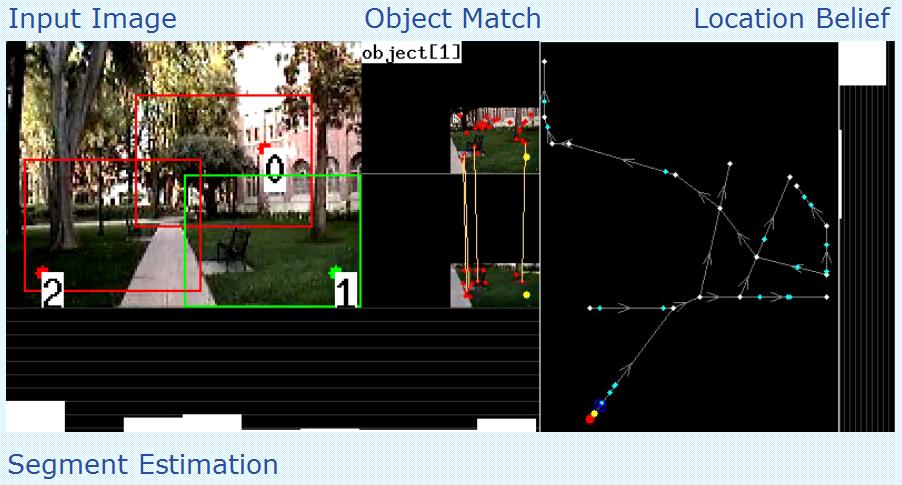
The radius of the circle above represents 10 feet in the real world. A video of a test run for Ahmanson Center for Biological Science can be viewed here
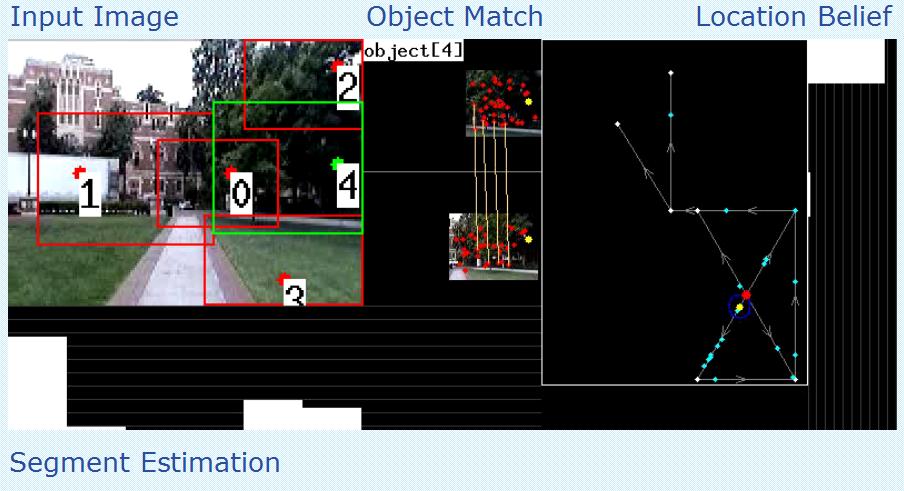
The radius of the circle above represents 5 feet in the real world. A video of a test run for Associate and Founders Park can be viewed here
The radius of the circle above represents 18.75 feet in the real world. A video of a test run for Frederick D. Fagg park can be viewed here
Copyright © 2000 by the University of Southern California, iLab and Prof. Laurent Itti