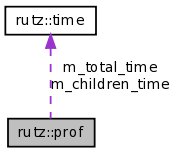
rutz::prof Class Reference
Accumulates profiling information for a given execution context. More...
#include <rutz/prof.h>

Public Types | |
| enum | timing_mode { WALLCLOCK, RUSAGE } |
| Different types of timing. More... | |
Public Member Functions | |
| prof (const char *s, const char *fname, int lineno) throw () | |
| void | reset () throw () |
| Reset the call count and elapsed time to zero. | |
| unsigned int | count () const throw () |
| Returns the number of calls since the last reset(). | |
| void | add_time (const rutz::time &t) throw () |
| void | add_child_time (const rutz::time &t) throw () |
| const char * | context_name () const throw () |
| const char * | src_file_name () const throw () |
| int | src_line_no () const throw () |
| double | total_time () const throw () |
| Get the total elapsed time in microsecs since the last reset(). | |
| double | self_time () const throw () |
| Get the total self time in microsecs since the last reset(). | |
| double | avg_self_time () const throw () |
| Get the per-call average self time in microsecs since the last reset(). | |
| void | print_prof_data (FILE *f) const throw () |
| Print this object's info to the given file. | |
| void | print_prof_data (std::ostream &os) const throw () |
| Print this object's info to the given stream. | |
Static Public Member Functions | |
| static timing_mode | get_timing_mode () throw () |
| Get the current timing_mode. | |
| static void | set_timing_mode (timing_mode mode) throw () |
| Set the current timing_mode. | |
| static rutz::time | get_now_time (timing_mode mode) throw () |
| Get the current time according to the given timing_mode. | |
| static void | print_at_exit (bool yes_or_no) throw () |
| Whether to write a profiling summary file when the program exits. | |
| static void | prof_summary_file_name (const char *fname) |
| Specify the filename for the profiling summary (default is "prof.out"). | |
| static void | reset_all_prof_data () throw () |
| Reset all call counts and elapsed times to zero. | |
| static void | print_all_prof_data (FILE *f) throw () |
| Print all profile data to the given file. | |
| static void | print_all_prof_data (std::ostream &os) throw () |
| Print all profile data to the given stream. | |
Detailed Description
Accumulates profiling information for a given execution context.rutz::prof, along with rutz::trace and associated macros (e.g. GVX_TRACE()) form a basic profiling facility.
GVX_TRACE() statements collect timing information at function entry and exit (or, more precisely, at construction and destruction of the local object that is introduced by the GVX_TRACE() macro call). The overhead for this profiling information is non-zero, but is completely neglible in proportion to the amount of execution time taken by any of the functions in FilterOps.
To turn on profiling in a given source file, just include "rutz/trace.h" and insert a GVX_TRACE() wherever you like. To force profiling to be off, define GVX_NO_PROF before you include "rutz/trace.h".
In order to actually see the profiling information, you can either call rutz::prof::print_all_prof_data() directly, or you can call rutz::prof::print_at_exit(true). If you do the latter, then when the program exits, the profiling information will be dumped to a file named 'prof.out' in the current directory. Currently, the only program that generates a prof.out in this way is bin/invt (the tcl script interpreter).
Profiling information in prof.out looks like the following, where the first column is the average total usec per call, the second column is the number of calls, the third column is the total self usec (i.e. excluding time attributed to nested GVX_TRACE statements), the fourth column is the total self+children usec, and the remainder of the line is the function name or whatever string was passed to GVX_TRACE():
4 4500 18999 18999 xFilterClean 5 4500 23998 23998 yFilterClean 305 11600 34998 3548467 lowPassX 8 4900 42997 42997 lowPass3y 297 11600 44994 3454495 lowPassY 15 4900 77989 77989 lowPass3x 508 14700 7458831 7477830 lowPass9x 582 14700 8534732 8558730 lowPass9y 8749 4000 25762090 34996666 orientedFilter
Definition at line 89 of file prof.h.
Member Enumeration Documentation
The documentation for this class was generated from the following files: